Writing — Test 0106
60:00
Task 1
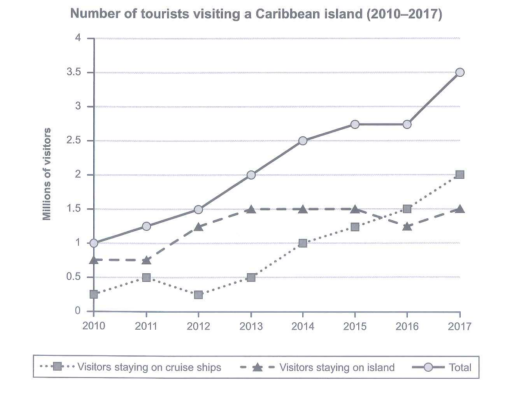
The graph below shows the number of tourists visiting a particular Caribbean island between 2010 and 2017. Summarize the information by selecting and reporting the main features and make comparisons where relevant.
Write at least 150 words.
0 / 150 wordsAutosaves every 5 seconds.