Writing — Test 0101
60:00
Task 1
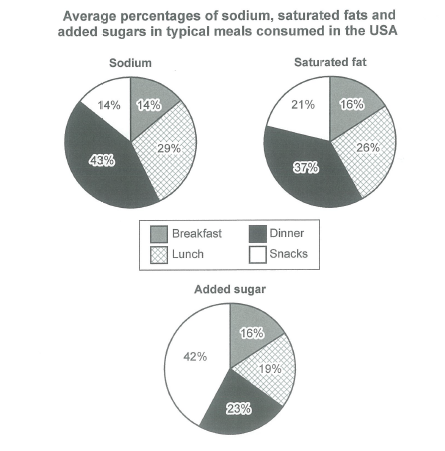
The charts below show the average percentages in typical meals of three types of nutrients, all of which may be unhealthy if eaten too much. Summarize the information by selecting and reporting the main features, and make comparisons where relevant.
Write at least 150 words.
0 / 150 wordsAutosaves every 5 seconds.