Writing — Test 0084
60:00
Task 1
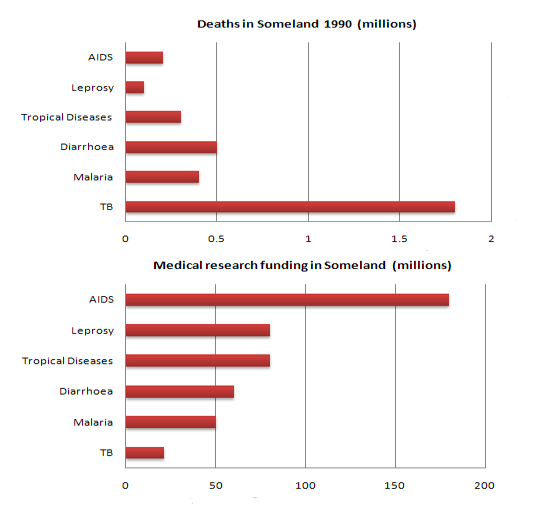
Write a report for a university lecturer describing the information in the graphs below.
Write at least 150 words.
0 / 150 wordsAutosaves every 5 seconds.
Write a report for a university lecturer describing the information in the graphs below.
Write at least 150 words.