Writing — Test 0075
60:00
Task 1
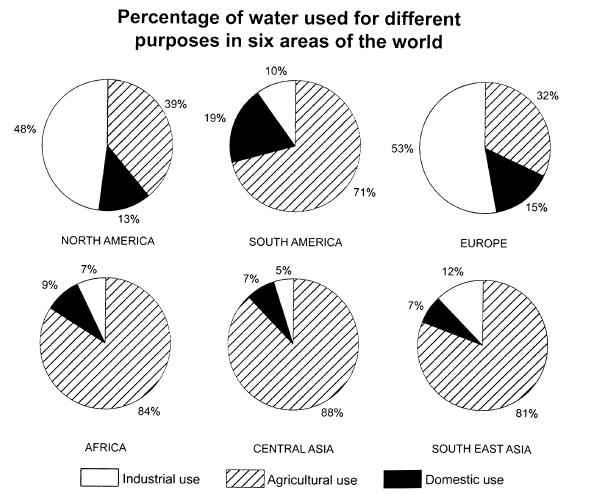
The chart below shows the percentage of water used for different purposes in six areas of the world. Summarize the information by selecting and reporting the main features and make comparisons where relevant.
Write at least 150 words.
0 / 150 wordsAutosaves every 5 seconds.